Your portfolio, together.
Add sites with their own ad provider and currency. See a combined view or focus on one property.
Try switching sites BrightstoneRevenue Dashboard

 MGID
MGIDA clearer picture of your publishing business. Bring ad revenue, live visitors and monthly goals together inside WordPress.
Your WordPress. Your connected sites. Your view.
Revenue DashboardInteractive exampleMGIDGoogle AdSenseGoogle Analytics 4MGIDWBuilt for WordPressThe daily picture, connected
Start with the number that matters. Then see the traffic, pace and properties behind it.
Add sites with their own ad provider and currency. See a combined view or focus on one property.
Try switching sitesMonthly progress, an expected pace and the next milestone give your earnings a little more context.
Watch a goal completeGive Finance users a dashboard view and schedule visual reports for Telegram or Viber.
See the report experienceA closer look at monthly targets
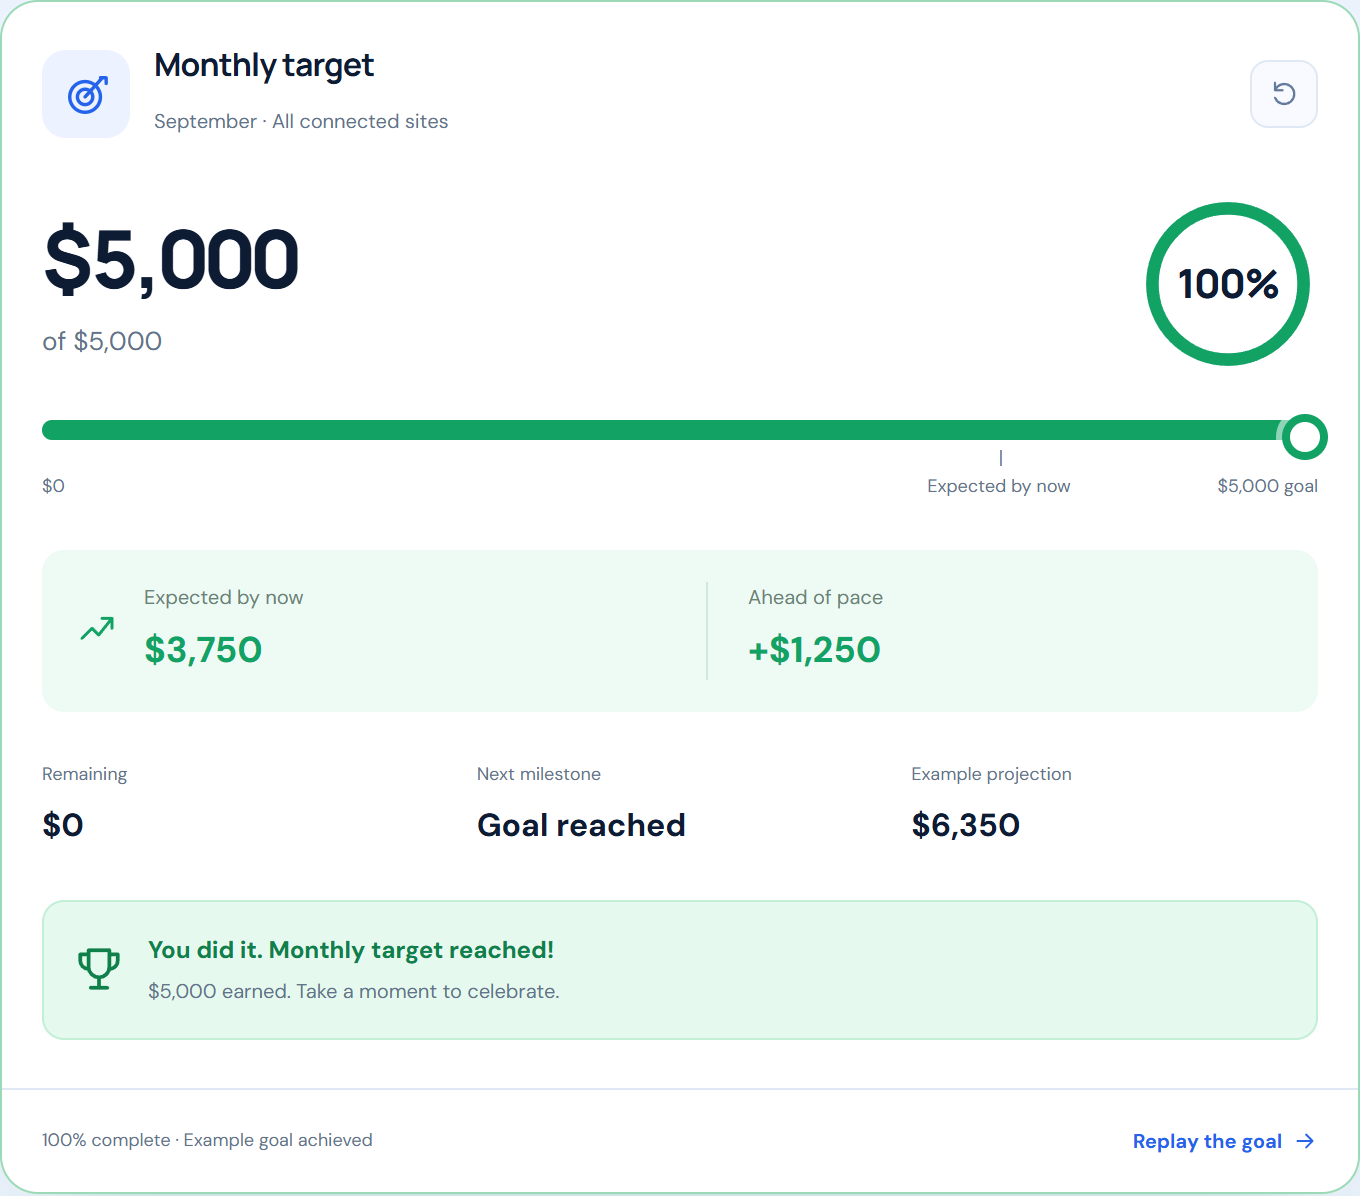
Turn a monthly number into visible progress. Know what you’ve earned, how far you have to go, and whether you’re ahead of the expected pace.
The demo fast-forwards an example month. Replay it whenever you like.
Traffic beside earnings
A revenue total tells you what happened. Live traffic helps you understand what’s happening now.
Your numbers. Your style.
Classic clarity, Momentum’s pace, Focus’s simplicity, or Mission’s energy. Try the styles below.
Revenue DashboardStyle preview · Demo dataClassic keeps totals, progress and traffic in a familiar, clearly structured layout.
A personal preference. Finance and admin users can save a style for their own account. The plugin reloads to apply it; other users keep their own view.


Keep the team in the loop
Bring the report to the conversation. Send revenue, traffic and monthly progress as a readable image in Telegram or Viber.
An interactive example of the report experience.
Get a closer look
Open a full-size example. Explore the goal card, revenue controls and analytics without squinting at a whole dashboard.
From setup to a daily habit
A few deliberate connections bring the whole picture together.
Activate the WordPress plugin. Add your sites and their ad provider credentials, then connect Google services for AdSense and GA4 where needed.
Choose currency and timezone settings, add a monthly target, and give the right people access. Each connection supplies its own data.
Open your dashboard, compare date ranges, review the daily breakdown, export CSV data, and choose a reporting schedule for your team.
Review yesterday, the current month or a custom date range. Daily averages and best-day figures add context to a single headline total.
Configure source currencies and conversion settings, then use the display switcher. This page’s demo uses an illustrative $1 = €0.86 rate.
A dedicated Finance role gives eligible users access to the revenue dashboard. Personal styles help each person read the information their way.
Use the daily breakdown and CSV export when you want to review a period outside the dashboard. Use scheduled visual reports for a quick shared summary.
A little more clarity
Brightstone Metrics is a WordPress plugin. Its responsive dashboard runs on your own site and can be opened on a phone, tablet or desktop.
Revenue integrations include Google AdSense, AdsKeeper and MGID. Google Analytics 4 supplies configured analytics data. Telegram and Viber are used for scheduled report delivery. Each service needs its own setup.
Yes. Configure properties with their providers and source currencies, then choose an individual site or a combined view. Analytics continues to reflect the configured tracking audience.
It combines recorded earnings with an estimate for the remaining days at a recent daily rate. It is an estimate, not a promise. Expected pace compares progress with where a steady month would be at the current point in the month.
Finance and admin users can save their own style preference. The dashboard reloads to apply it to their account, without changing other users’ selections.
No. This page uses fictional, interactive examples to explain the interface. Network switching, goal completion and report delivery are demonstrations. Your installed plugin shows data from the providers you configure.
Configure a Telegram bot or the appropriate Viber channel details, choose your sites and reporting options, and enable scheduling. Delivery also depends on the provider connection and your WordPress scheduling setup.
Yes. Starter has a 14-day trial, but the trial starts only after you add a payment method in Paddle checkout. Growth and Scale are paid immediately.
Choose your plan
Checkout is handled by Paddle. Your card details never pass through Brightstone, and the exact recurring price and any applicable taxes are shown before you confirm.
Starter includes a 14-day trial after a payment method is added. Growth and Scale begin billing when checkout completes.
One site, daily figures and a monthly target. Card required; 14-day Paddle trial.
Price and taxes are shown in secure Paddle checkout.
Up to five sites, alerts and month exports. Billing starts at checkout.
Price and taxes are shown in secure Paddle checkout.
Unlimited sites and seats, with the full history. Billing starts at checkout.
Price and taxes are shown in secure Paddle checkout.
Bring your numbers together
Connect your sites. Set your next goal. Give your team a view they can understand.
Choose your planOr explore the demo